- Home
-
Pricing & Products
- Pricing plans
- Product Features
- Pricing plans - Educational License
- VoxVote - Streaming Video integration
- VoxVote Designer - Create your own events
- VoxVote Live - Start voting now - for you in the audience
- VoxVote Slides
- VoxVote Chat - Question and Answer module
- VoxVote Colour Voting
- VoxVote Quiz - Interactive quiz
- VoxVote Branding - Company logo
- VoxVote Branding - Custom URL and web app
- VoxVote - Images
- List of educational institutes
- Tutorials
- Cases
- About
- Contact
Tutorial Step by Step
This topic is a bit more advanced and describes the steps to create a live crossing overview of two questions.
(If you are totally new, start the quick start guide first) Also known as pivotcharts or crosstabs.
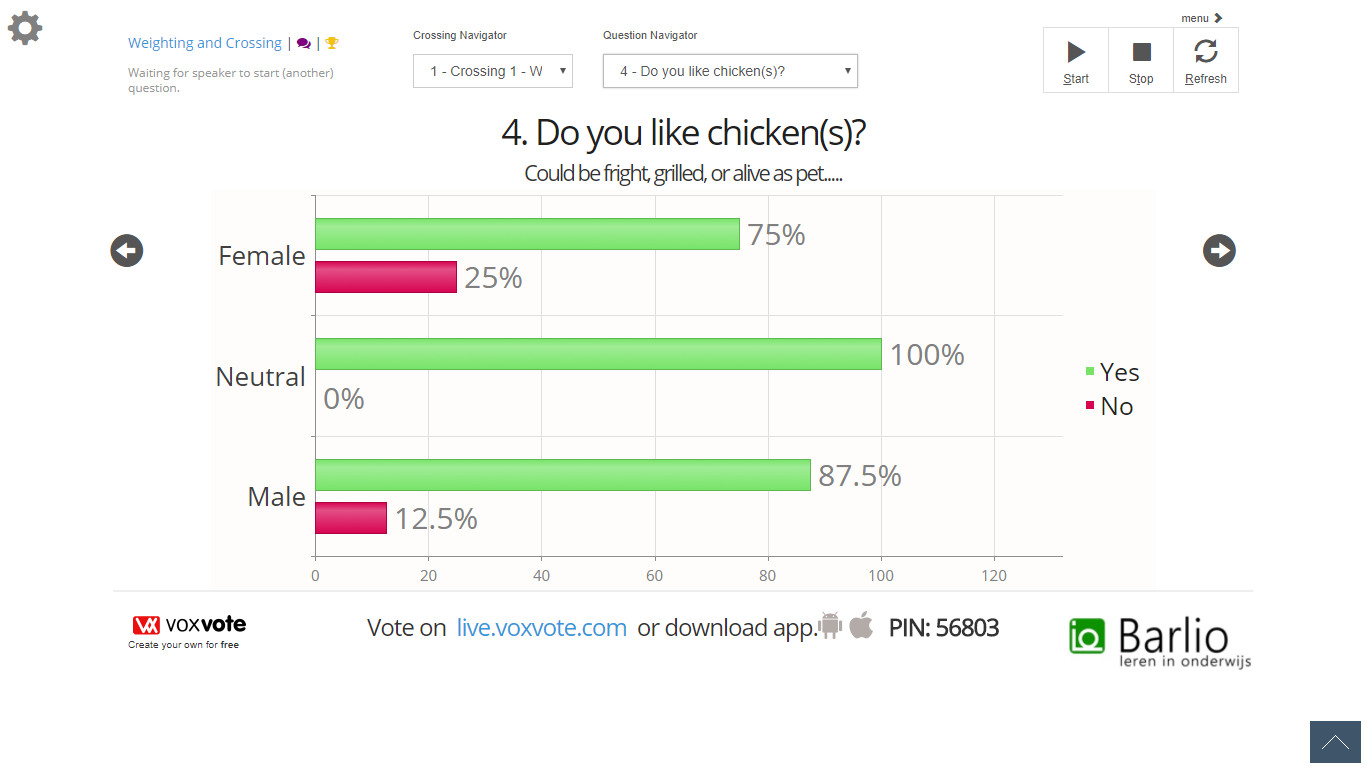
In a standard result chart, you will only see one question reported. With crossing you can combine 2 questions in a (live) view. For example, make a crossing of question 'Gender' (male/female/neutral), and another quesion. Do you like chicken?
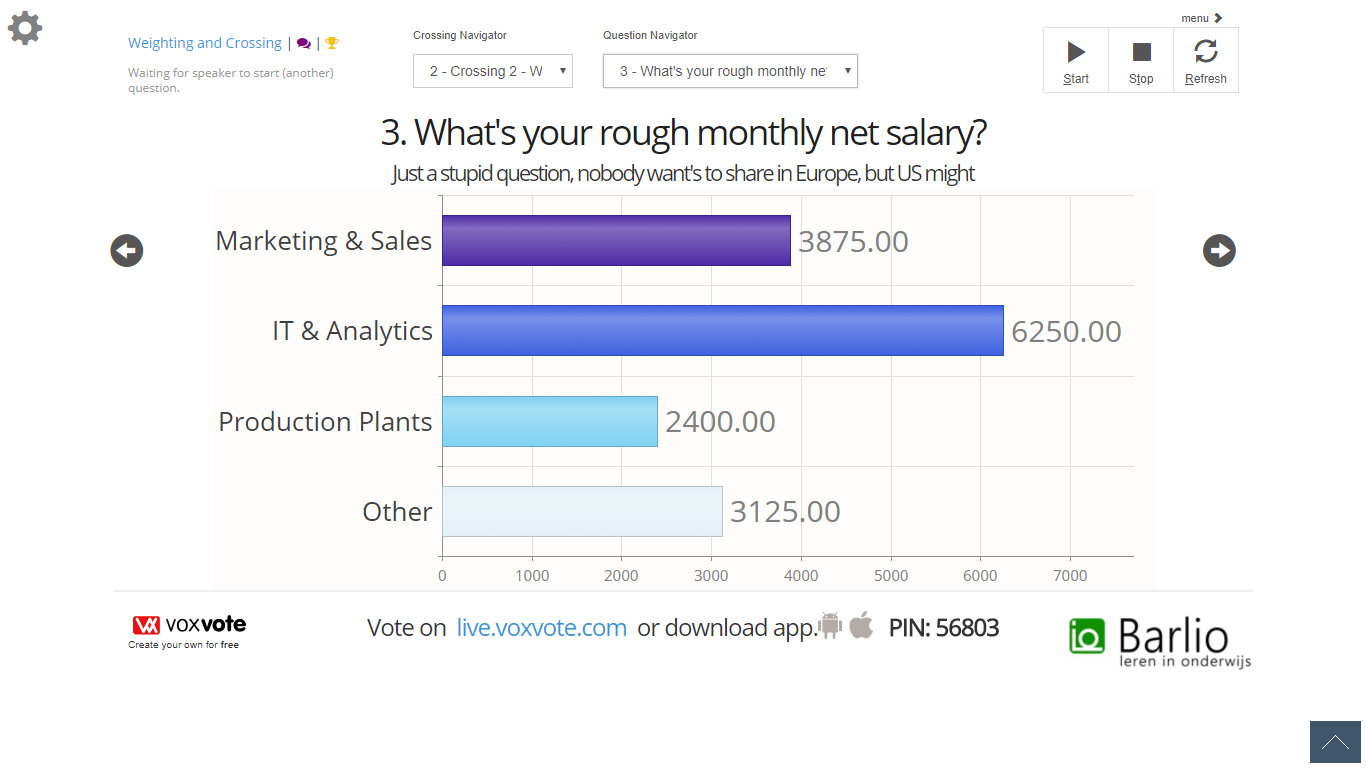
Figure A. Department x Average salary: The left shows the departement question. The data is question 3 - Rough monthly Salary.
Minimum requirements:
- A free or paid account.
- Some experience in VoxVote, where you know what collecting data is in preview or live mode.
- You are familiar with the editor. (adding questions and answer options, changing color, test in preview mode)
- Optional: have 2 or 3 voting devices for testing and filling some preview data. (A pc with both chrome, safari, firefox will also do, to make multiple votes.
Did you know?: Did you know that you can add the crossing option after a normal data collection / normal poll. It doesn't affect the recorded data. You can make changes whenever you want.
Ready? We are going to create the following
Part A. Create 4 simple questions
Part B. Collect data in preview/test mode
Part C. Start Crossing. Examples and data export in Excel
Step A1. Create question 1. "Gender"
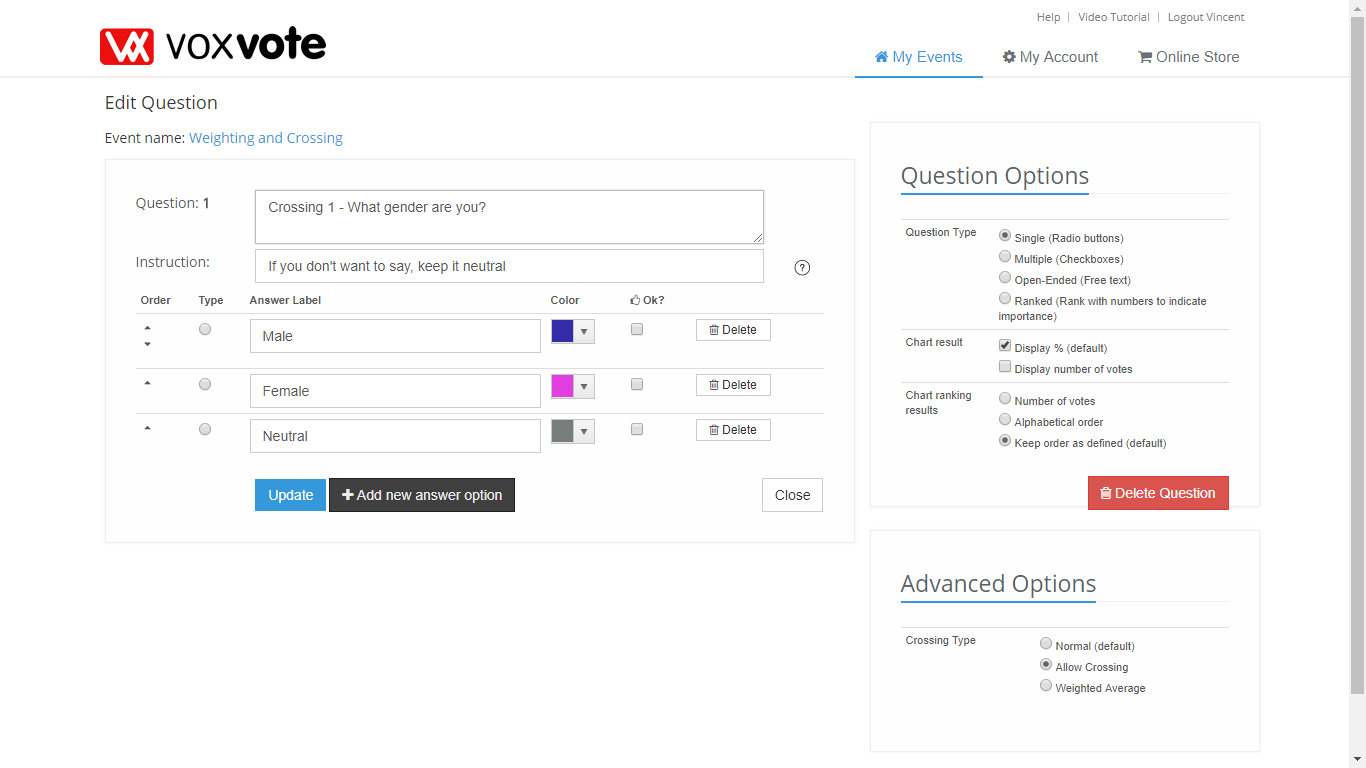
Create a new empty project, name the event Tutorial, and add the following question "Crossing 1 - What gender are you?"
Add 3 answer options, with the following values to vote: Male, Female, Neutral
- Adjust the colors, so it looks better in reporting of crossing. (if you all leave it green, it's harder to see the crossing results.)
- On the right, in question options, make sure the Question Type is 'Single'
- On the right "Advanced Options", set crossing type to "Allow Crossing"
Your question 1, should look something like this: When satisfied, press the blue 'Update' button. Which will bring you to the question overview screen for this tutorial project/event.
Step A2. Create question 2. "Department"
Add another normal question with the following question text: "Crossing 2 - What product team / department are you?"
With the following 4 answer options:
- Marketing & Sales
- IT & Analytics
- Production Plants
- Other
And again, just like in step 1, set the advanced setting to allow crossing, and update.
Step A3 - Create Question "Salary"
You are already half way! Keep on going!
The purpose of this question is that we wont' report on % of salary, but that we want to report on the average salary of the Men or Women who voted.
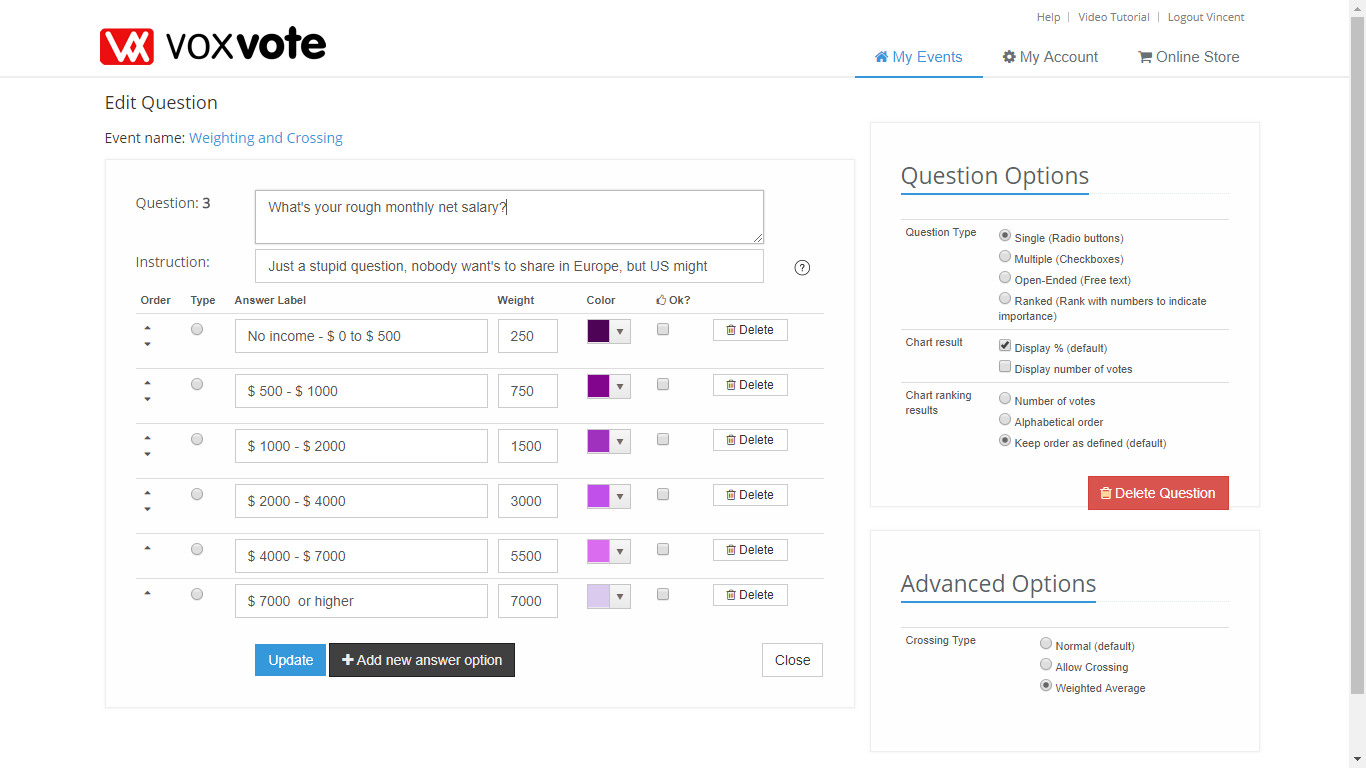
Add another question with the following questiontext: "What's your rough monthly net salary?"
And add 6 answer options to vote on. Adjust the colors to nice scale. We started with dark purple color: #4f0356. If you make the first colors correct, the add new answer button will re-use your latest color:
- No income - $ 0 to $ 500
- $ 500 - $ 1000
- $ 1000 - $ 2000
- $ 2000 - $ 4000
- $ 4000 - $ 7000
- $ 7000 or higher
In the advanced section, make sure you set the Crossing Type to "Weighted Average", and you will see a new column appearing in btween the answer label and color.
Fill the weighted with a salary in the middle of the answer options. For example the first option 0-500, has a weight of 250.
Use the following weights. (The weights might be arbitrary and not statistical correct, but for the purpose of this tutorial good enough.)
- 250
- 750
- 1500
- 3000
- 5500
- 7000
Your question 3 should look like this, when done, update your question to navigate to question overview.
Step A4 - the last question "Chicken"
Add the last question with the following questiontext: "Do you like chicken(s)?" ((Like in a way of grilled, or alive as pet, al up to you)
And add 2 answer options to vote on. Yes and No. (Change the No question to a red color)
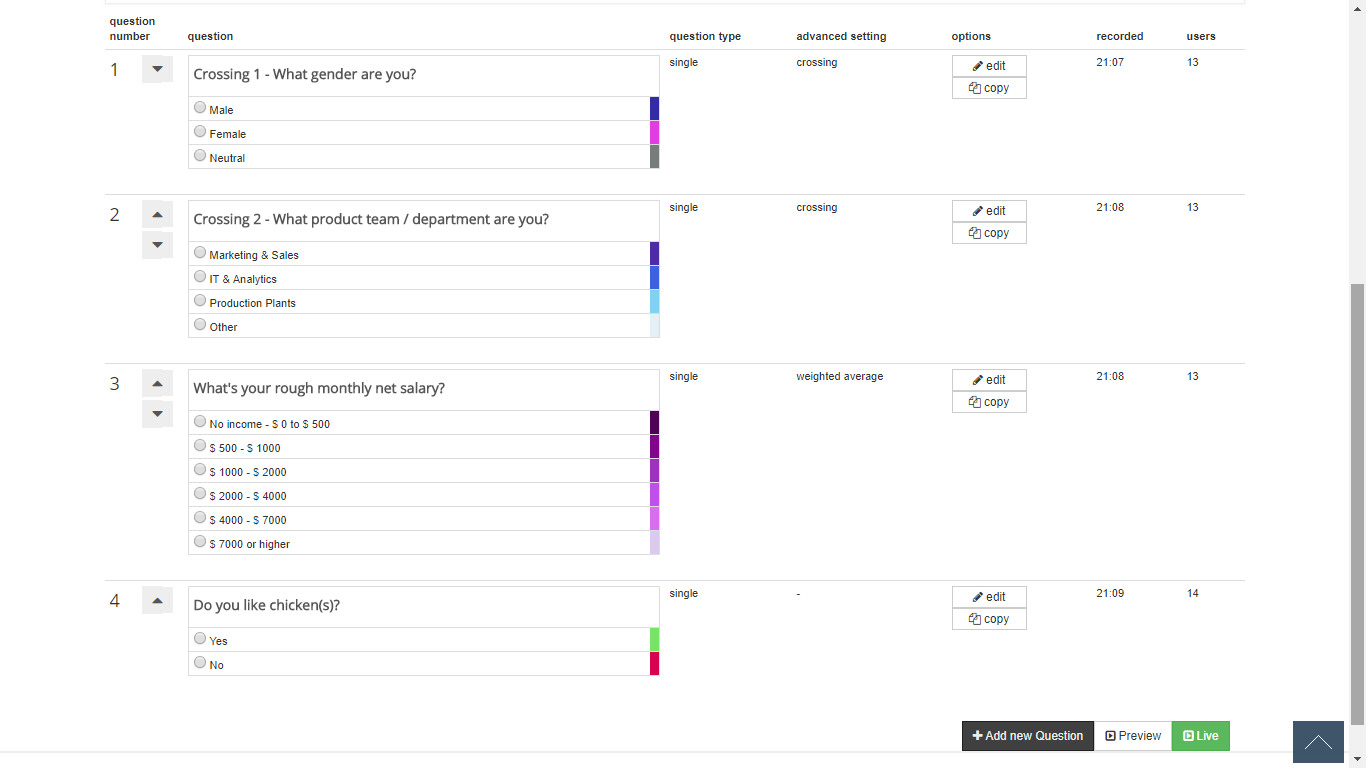
Keep all the rest default. (no special crossing), update the question, and your 4 question overview should look like this: Check on the 4th column: it should show crossing, crossing, weighted average. If not,make the changes in the question that needs some altering.
Step B5 - Data collecting. (Preview mode)
In this steps, we will collect some data. We need a smartphone for voting, or some extra browser screens. (You can reopen multiple tabs, and resize it to a smartphone size). In preview mode, you can re-vote multiple times from the same location. (In live mode, only 1 vote per question is allowed). The easiest is of course with a group of 3 persons with their smartphones, but in this example you can pretend you are already having an audience.
As written in the pre-requirements, we stated to be familiar with some data collecting and opening and closing a question.
Checklist before we begin:
- Make sure the timer (autoclose timer is disabled). When timer is on 30 seconds, you will be a bit stressy to collect data on multiple devices. So our advices is: no timer.
- Hit the preview button. An empty screen should be visible.
- Check the PIN code instruction at the bottom, so you know the address
- Click the link https://live.voxvote.com to open a new browser window, and fill in your numeric PIN code displayed at the bottom of your preview screen.
- Repeat this for 2 or more times, so you have 3 or more voting devices available. Or multiple laptops, or multiple smartphones logged in. In the screenshot below, we openend 2 chrome windows, and one Internet Explorer window. (You can drag a tab from the browser, and resize it).
- Question 1 - "Crossing 1 - What gender are you. Should be visible on the question navigator."
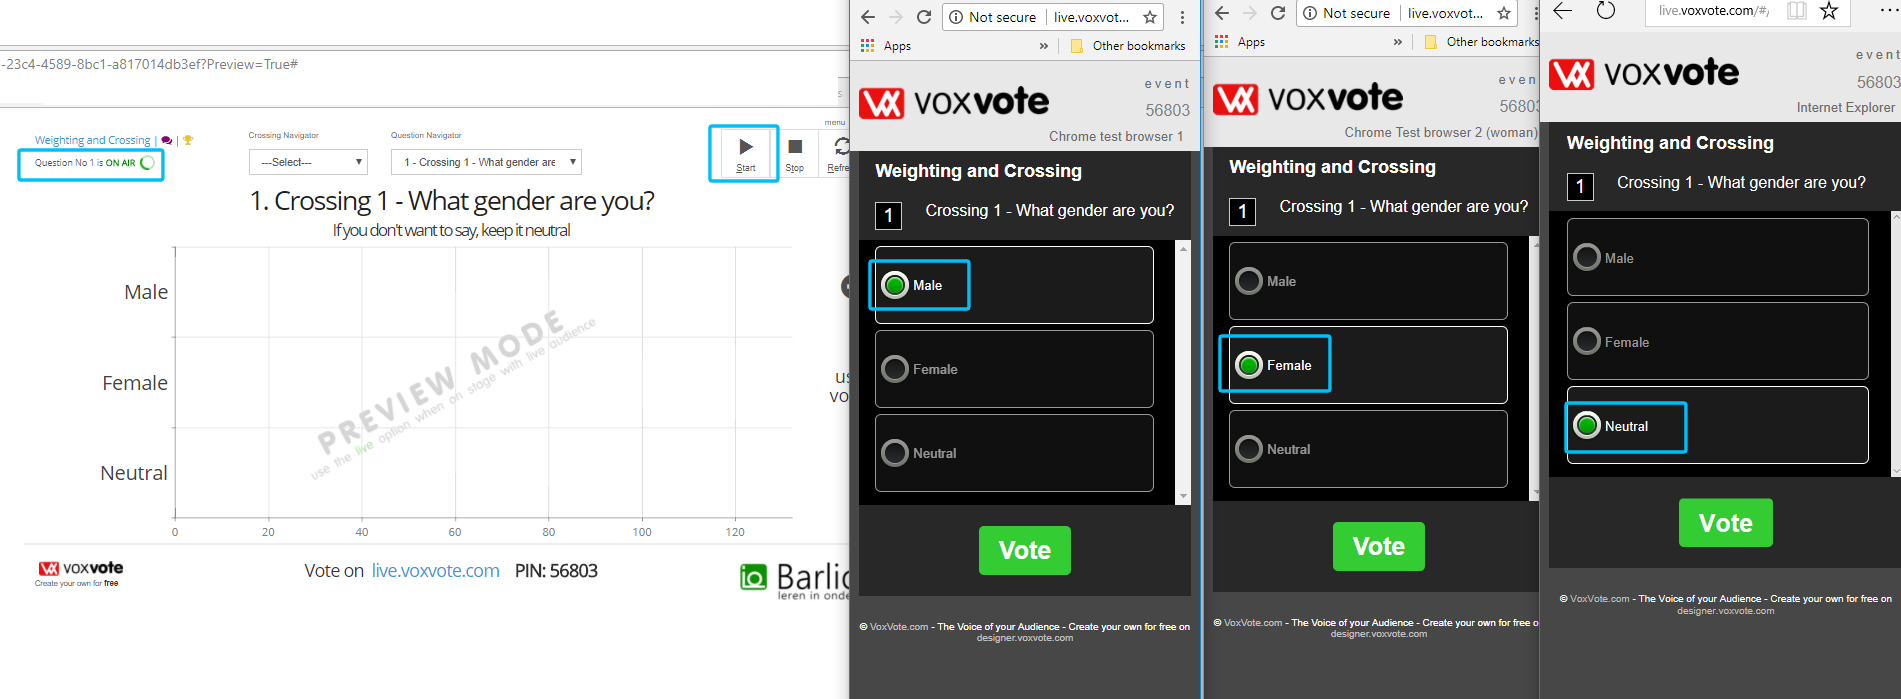
Ok, it's time to start the first question. Press Start button (or keyboard letter S), a green icon "Question 1 is On Air" should appear.
And on all your voting devices, you should see the first question.
Vote them, and make some variation. Vote at least for 1 man, 1 woman, and 1 neutral.
After your votes on the devices, the message should show: "Waiting for a new question". (Don't refresh the screens, or re-connect, this will trigger a new preview number, and you won't be able to cross another question.)
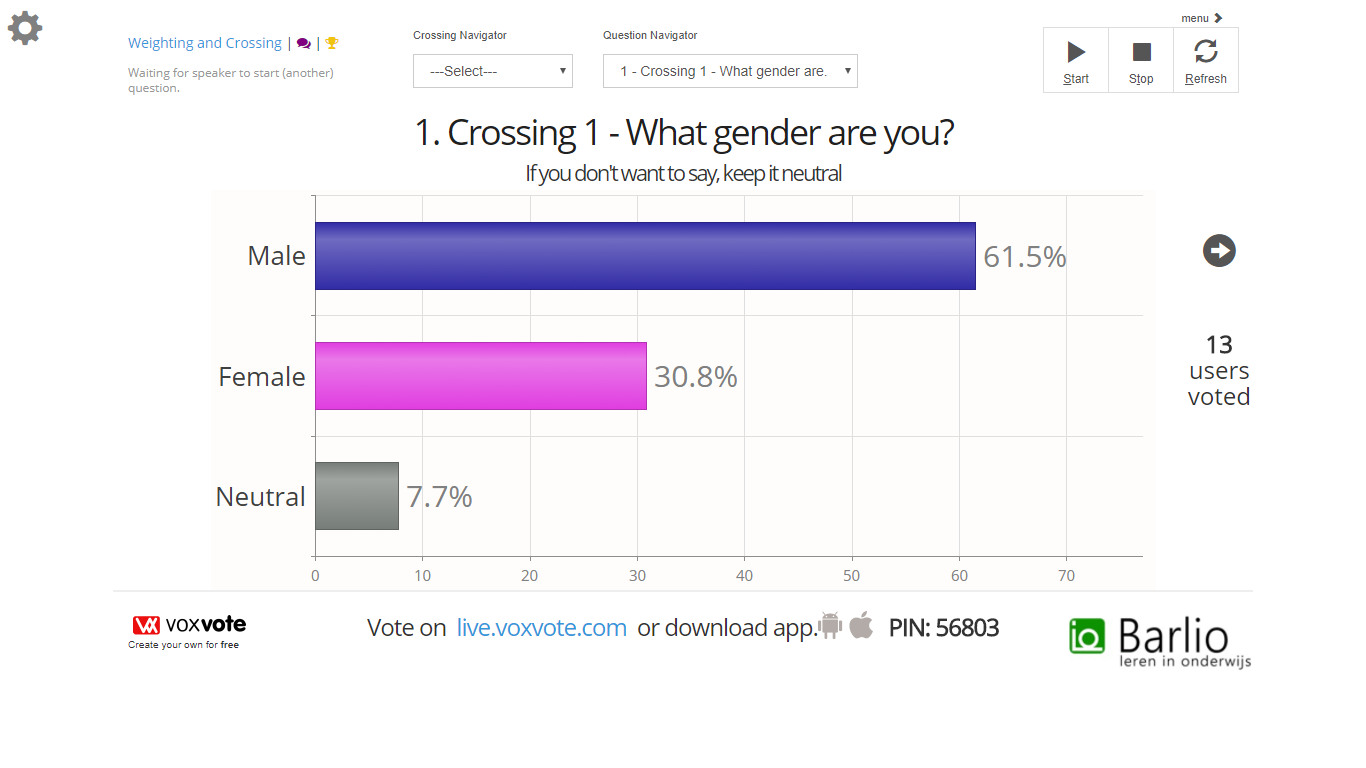
After your vote(s). And stopping question on the chart screen, you should see the 3 votes comming in. (and 33.3% if you have a 1 vote on all 3 options).
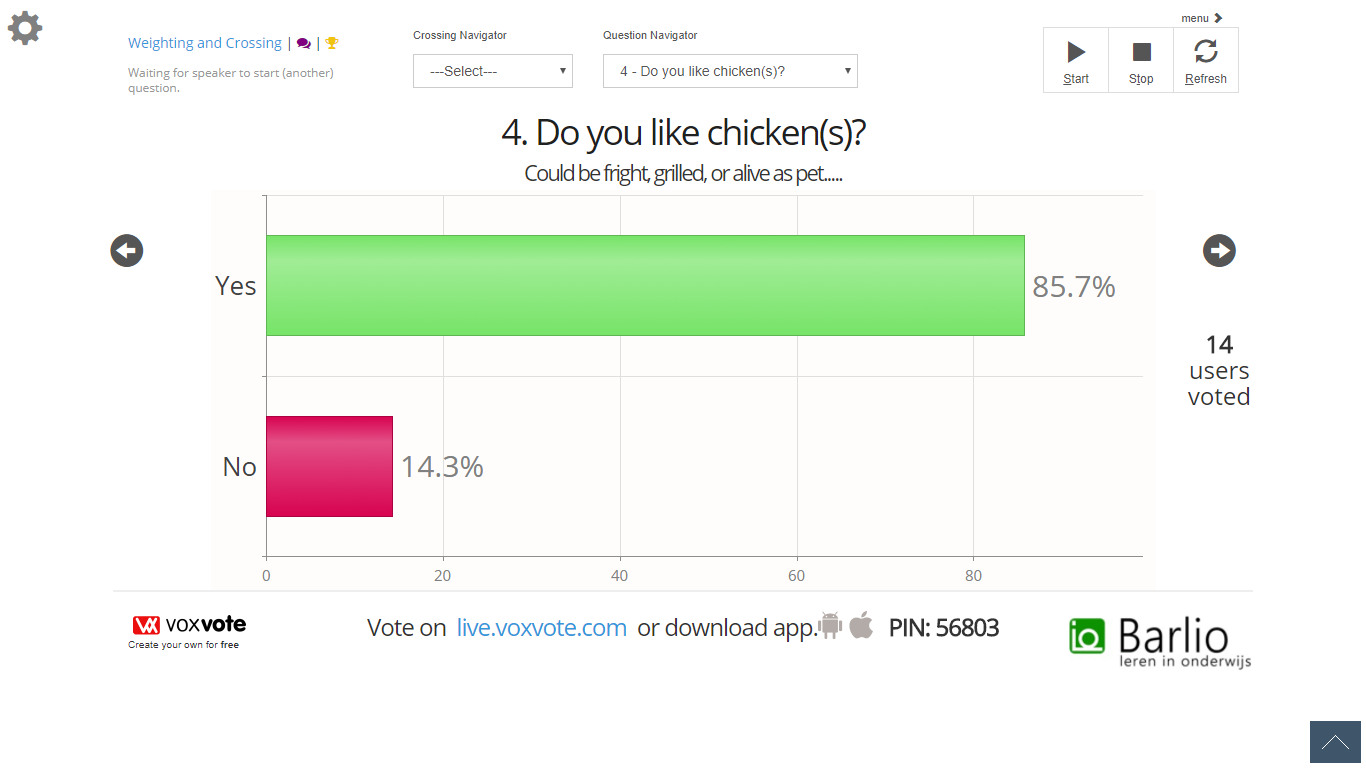
Your screen should look like this, where we used 13 users. You might have less. No worries.
Vote now on all other questions
Vote on question 2: "Department"
Navigate to the 2nd question in the question navigator or black arrow on the right.
Start question 2 (letter S, or Start button)
The 3 voting devices should show question 2. Vote for the departments.
Vote also on question 3: "Salary"
And on question 4: "Chicken"
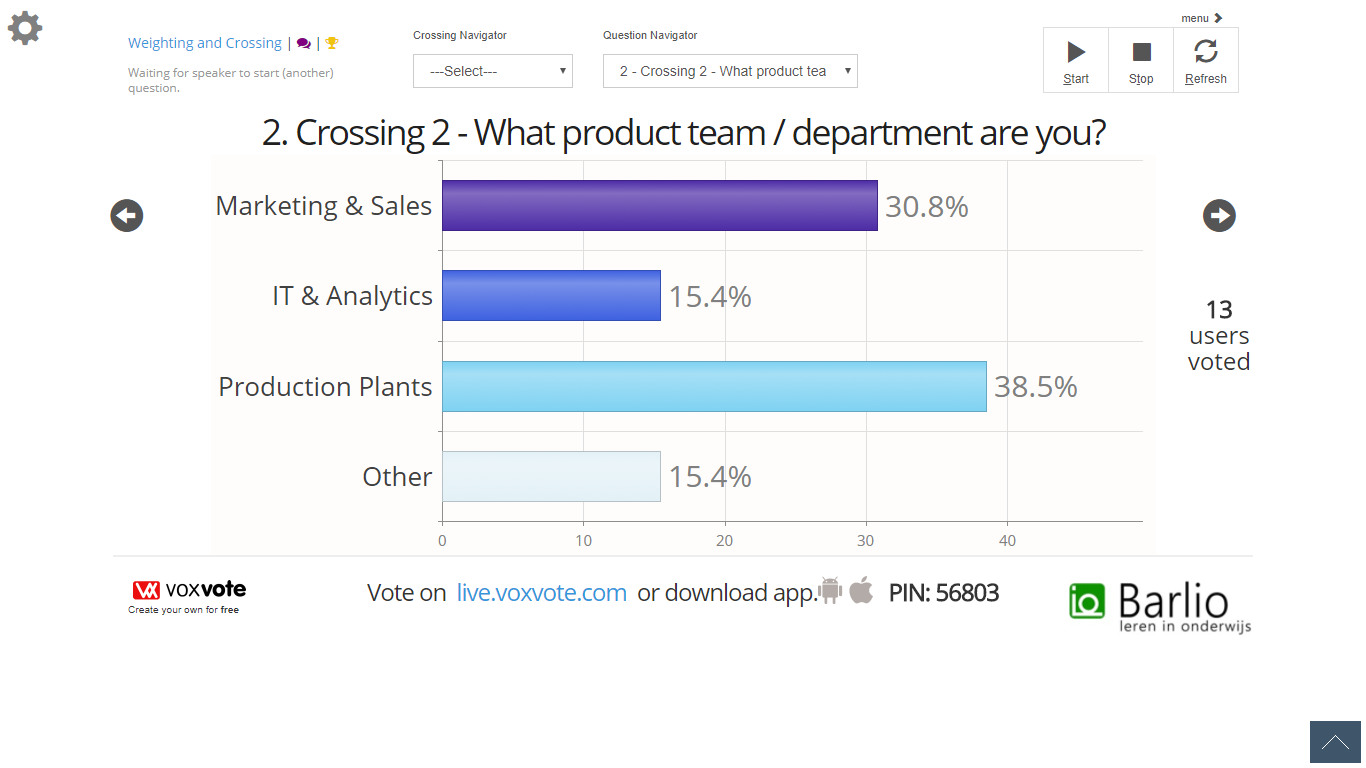
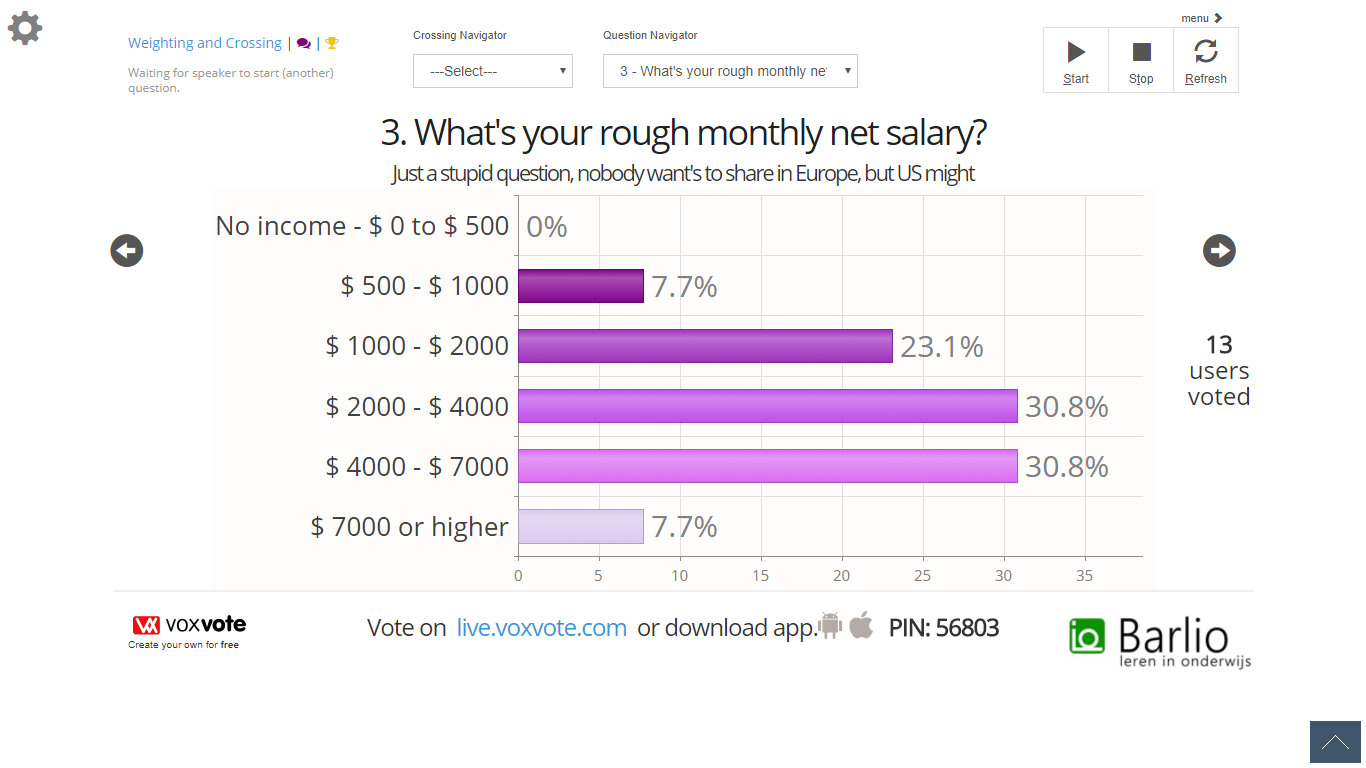
When you look at the questions, not yet crossed, your data for the first questions should look like this. Where we have 13 test records, in yours probably less.
 |
 |
 |
 |
Step C - Start crossing
Before we start crossing, have a look at the top Navigators.
The right Question Navigator shows the question you want to display on the chart, and the one you are collecting.
You can start that question, and the audience will see the question, if not already voted.
The left dropdown "Crossing Navigator" can add a existing question with data on it and combine it with another question in the question navigator.
(NB: When you don't have data yet on a crossing question, you can't make the combination. So always keep your crossing questions in the beginning of your polling questions.)
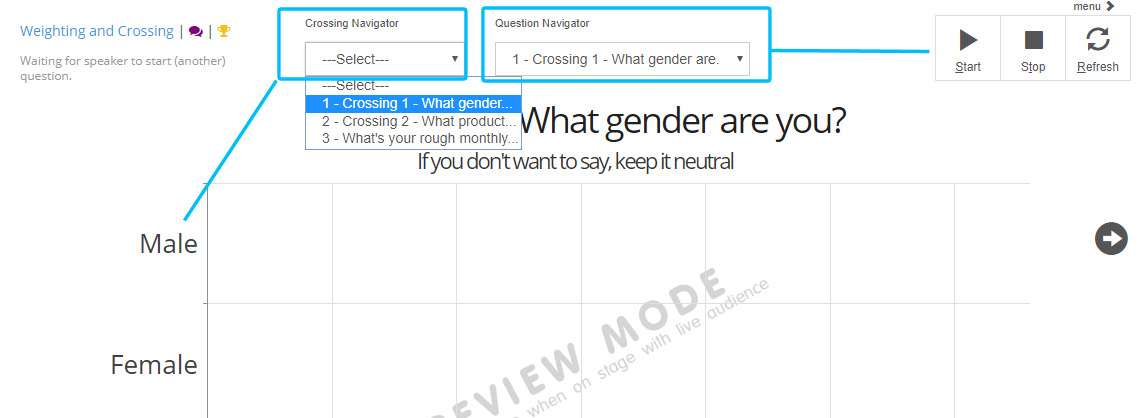
C1. Make a crossing between Q1 Gender and Q3 Salary.
From the left dropdown, select Q1 - Crossing 1 - Gender
From the right dropdow, select Q3 - What's your rough monthly net salary?
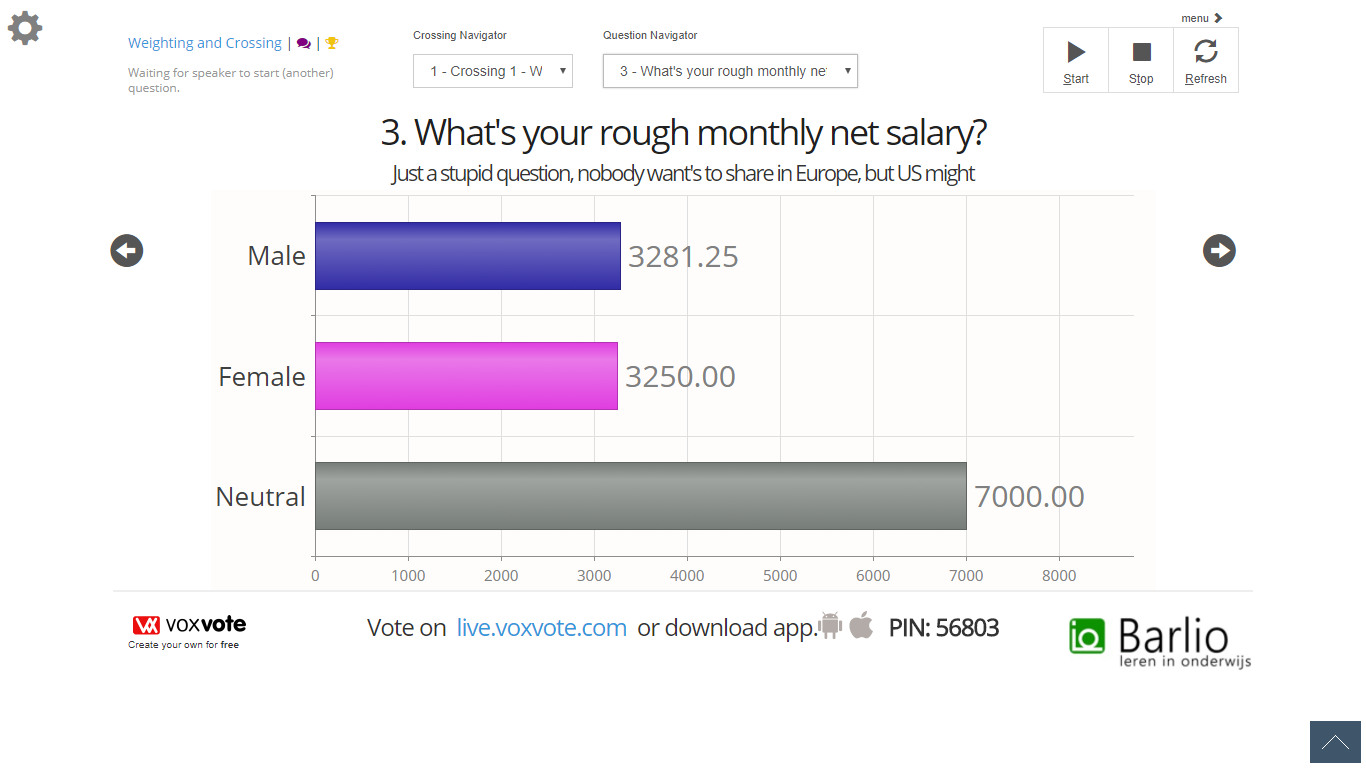
VoxVote will combine the male gender votes with the male salary and makes an average (mean) based on the weights. Also for Women and Neutral.
Where we in the intitial report had % of votes per answer. With the crossing active, the live chart will look like this.
Troubleshooting: I don't see the chart / have strange layout:
Check 1: In case you have a chart like this: you don't have enough data. If your crossing question (in the crossing navigator) has 3 options, make sure you have 3 votes from the audience.
So go back in preview mode, and add some more test records. (Open question 1, vote, Open question 2, vote, Open question 3, vote, etc.)
Because of preview mode, you can restart from the beginning, and fill in a streak for the person you want to vote - Q1, Q2, Q3. So you have to (re)open each question and vote a complete poll.
So don't vote Q1, Q1, Q1 on 1 device, and then Q2, Q2, Q2. But vote Q1, Q2, Q3, because we want to combine the answer on Q1 with Q3.
Yes it will work. You can also try to remove the answer option Neutral in the gender question.
Check 2: make sure the graphs are visible. In the gear setting, top left corner, the option to toggle the chart should not be red.
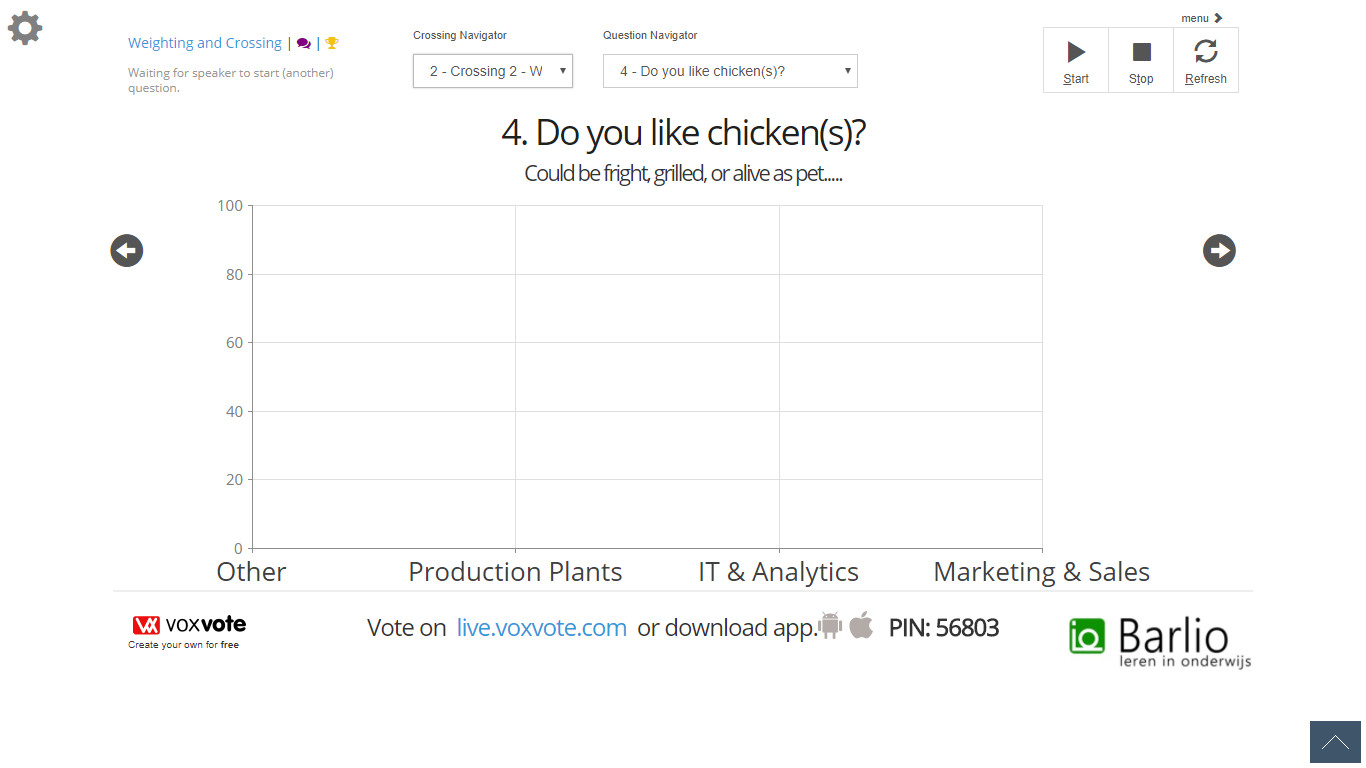
When we combine other crossings we can make views like this:
 |
 |
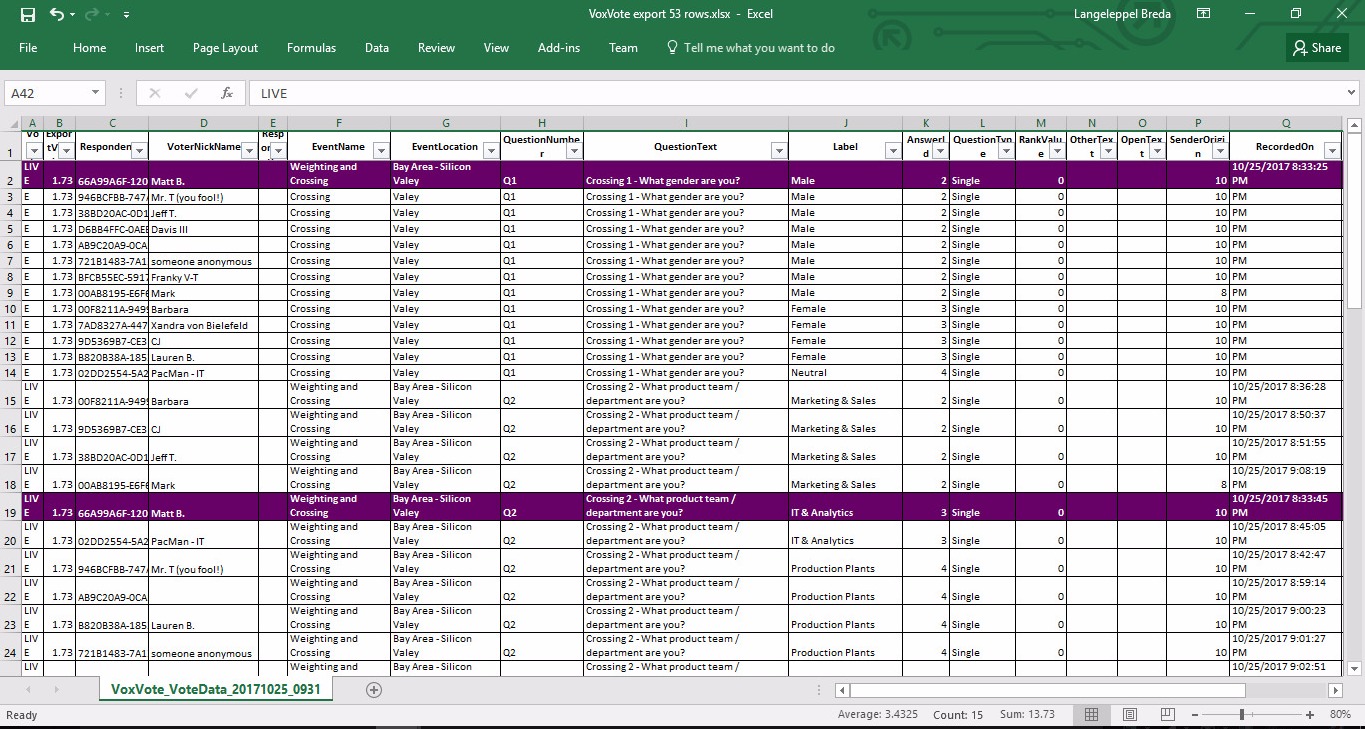
Also, if we look at the data preview in Excel (Download can be created from the start screen, and for this tutorial data, you can find it here) we can see the related votes from a person 'Matt B.' - purple in the chart. Because we know he answered 'Male' on the first question, we can combine his Salary and other consecutive questions.

 Deutsch
 English
 Español
 Français
 Nederlands
 Português
 Svenska